Climate
This section provides details on working with data from climate data files and then established weather stations for an area and using that data to analyze the effects of climate variables on pavement response and performance.
Introduction
Environmental conditions have a significant effect on the performance of both flexible and rigid pavements. Factors such as precipitation, temperature, freeze-thaw cycles, and depth to water table affect temperature and moisture contents of unbound materials, which, in turn, directly affect the load-carrying capacity of the pavement. Further, the temperature levels have a direct bearing on the stiffness in the case of asphalt materials, and temperature gradients induce stresses and deformations in the case of PCC layers.
PMED considers the affects of the environmental factors. Therefore, PMED models diurnal and seasonal fluctuations in the moisture and temperature profiles in the pavement structure brought about by changes in ground water table, precipitation/infiltration, freeze-thaw cycles, and other external factors. This dialog allows you to define the effects of climatic variables on pavement responses and pavement performance.
Ways to Access this Interface
- Click the edit pen for any design loaded in the Designs page.
- Click the “Climate” action menu item.
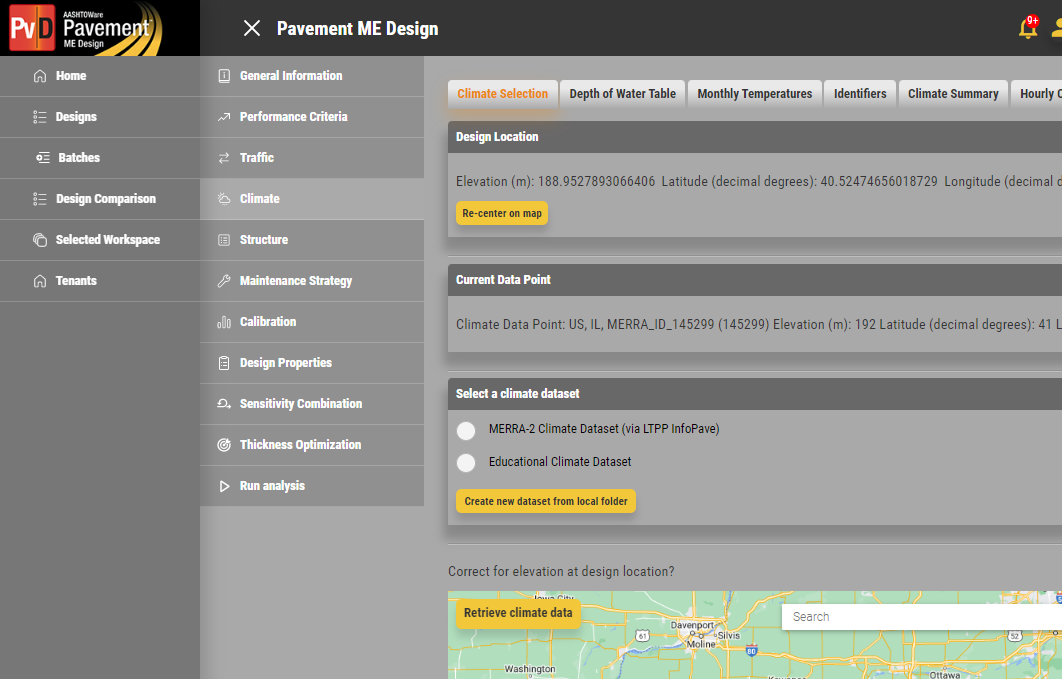
Figure 836: Climate component
Note:
Educational users only have access to 8 pre-specified climate data points.
Selecting a Design Location
The user can select a design location by clicking anywhere on the climate map. The component will present the user with the nearest MERRA climatic data points. These data points will show up as blue markers, while your selected design location will show up as a yellow marker.
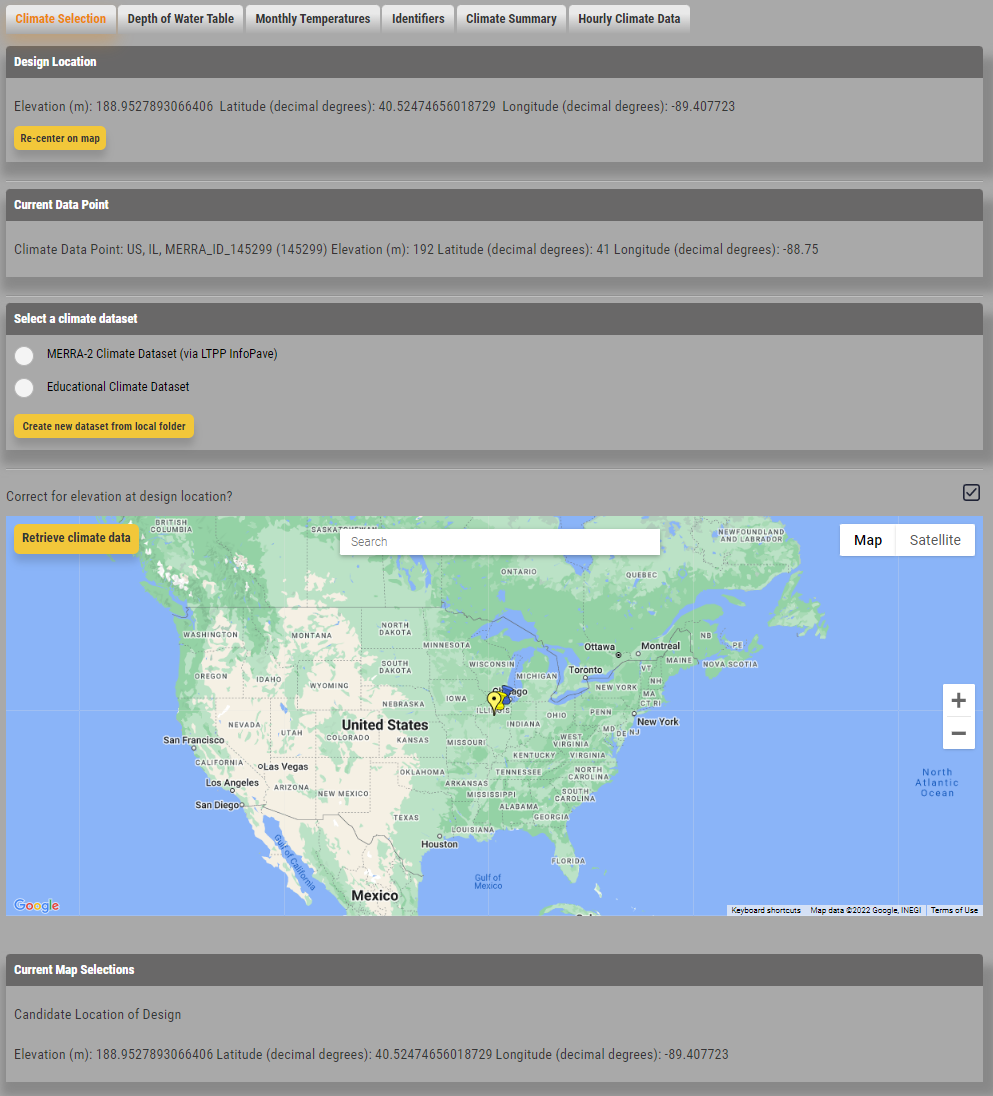
Figure 837: Selecting a design location
Climate Data Selection
There are 2 ways of selecting climate data for your design. (1) Retrieving climate data from the FHWA InfoPave site automatically, or (2) Uploading an existing set of HCD file(s).
To automatically retrieve climate data, after selecting a design location, the user should select 1 or more climatic data points by clicking on the corresponding red marker(s). Clicking on the red marker will turn it blue, marking it as selected. The user should next click the “Retrieve Climate Data” button. After a short loading interval, the climate data will be loaded into your design.
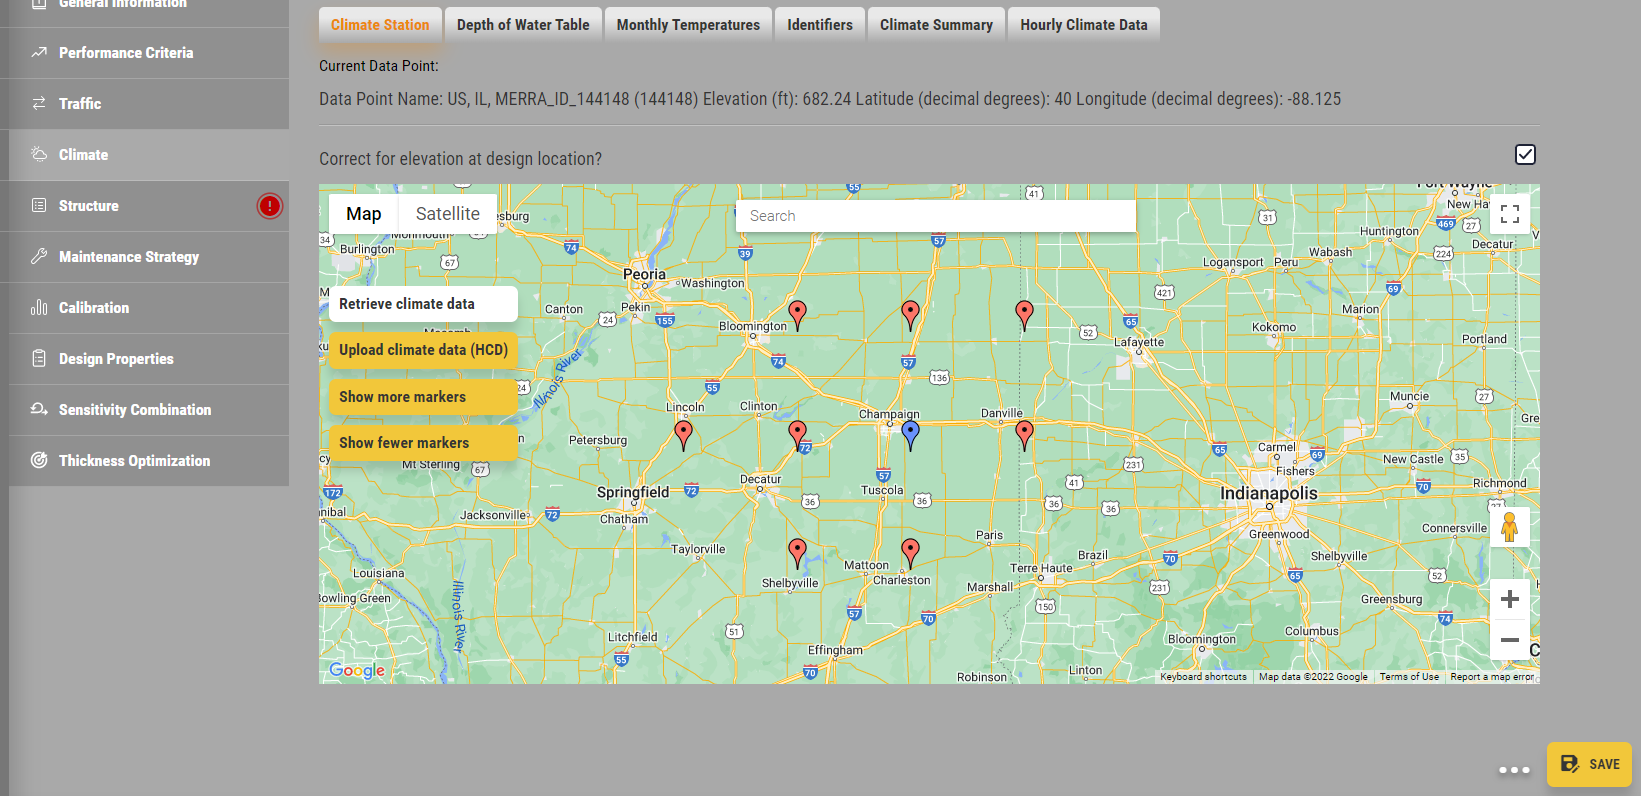
Figure 838: Selecting climate data
You can also upload HCD file data by selecting your design location on the map, then selecting one or more of the red markers (turning them blue), then selecting the “Upload Climate Data (HCD)” button. This will upload the climate data file using the elevation provided by the selected climatic data point on the map.
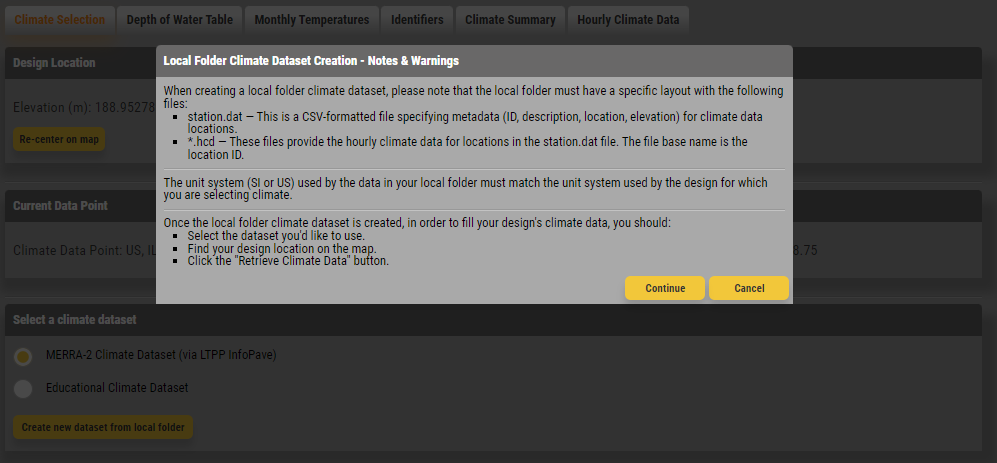
Figure 839: Upload climate data
Users can also search for a design location by typing in the name of a location in the Google search box, or by entering a latitude, longitude location in decimal degree format.
Longitude (decimal.degrees): Shows the longitude of the design site.
Latitude (decimal.degrees): Shows the latitude of the design site.
Note:
The latitude and longitude of climatic data points use North and West cardinal directions, respectively. For example, the geographic coordinates of Wichita, Kansas are 37°41′ N and 97°20′ W. You would define the latitude and longitude of this location as 37.68 and -97.33, respectively.
- Elevation (ft): Shows the elevation of the project site, which is used to determine the lapse rate that temperatures change due to change in elevation.
Other Features
- Correct air temperature for elevation at project location: Corrects the air temperature data based on the elevation at the specific project locations. Elevation correction is recommended in areas where significant elevation differences occur over a short distance such as mountainous terrain.
Depth of water table
Allows you to define average depth of ground water table on an annual or seasonal basis. The depth is defined from the top surface of the subgrade to the ground water table.
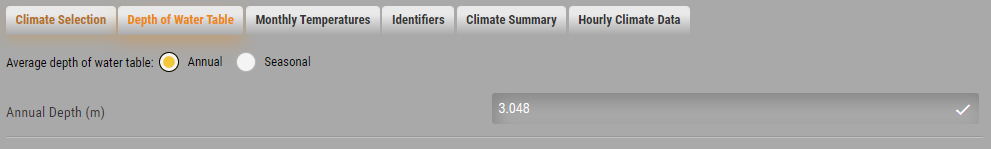
Figure 840: Depth to water table
- Annual: Mutually exclusive with the seasonal control. The depth of water table field in the climate component displays the annual designation and its associated water table depth (ft or m).
- Period: Annual
- Water Table Depth (ft): Enter the annual average water table depth value.
- Seasonal: Mutually exclusive with the annual control. Displays four seasonal designations and the water table value for each season. Selecting the “Seasonal” control activates the following table:
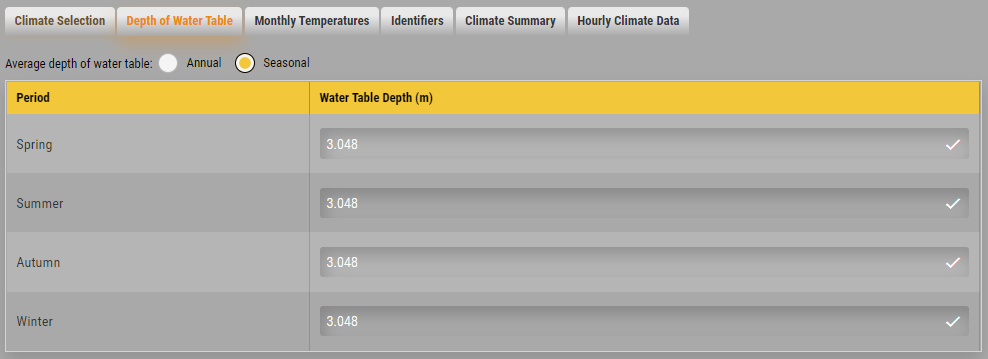
Figure 841: Seasonal water table
- Period Seasonal:
- Spring (Seasonal) – March to May
- Summer (Seasonal) – June to August
- Autumn (Seasonal) – September to November
- Winter (Seasonal) – December to February
- Water Table Depth (ft): Enter the average water table depth values for each season.
Other ways to use Climate Data
PMED allows other ways to use climate data:
- You can import/export climate data in XML format from a file or from an existing climate library using the corresponding option in the ellipsis (…) context menu.
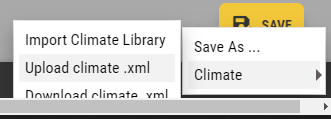
Figure 842: Importing and exporting climate data
Monthly Temperatures
Shows the average monthly temperatures for the selected climate data.
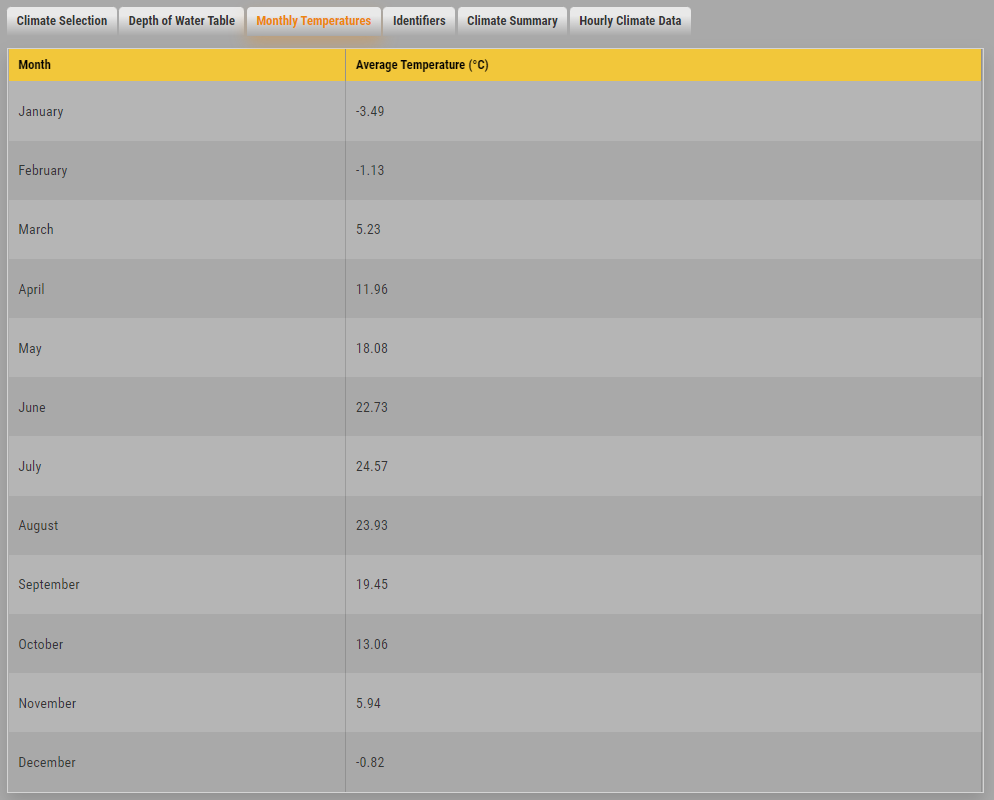
Figure 843: Monthly temperatures
Climate Summary
Shows the summary of temperature and precipitation data for your selected weather data.
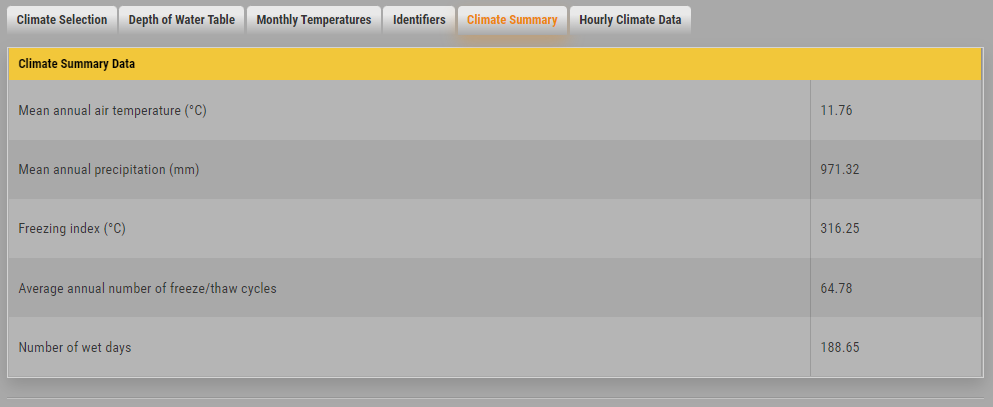
Figure 844: Monthly temperatures
Hourly Climate Data Tab
Hourly climate records for your selected weather data. Allows you to view the available hourly records for the start and end dates you select and verify if these records meet the minimum quality requirements.
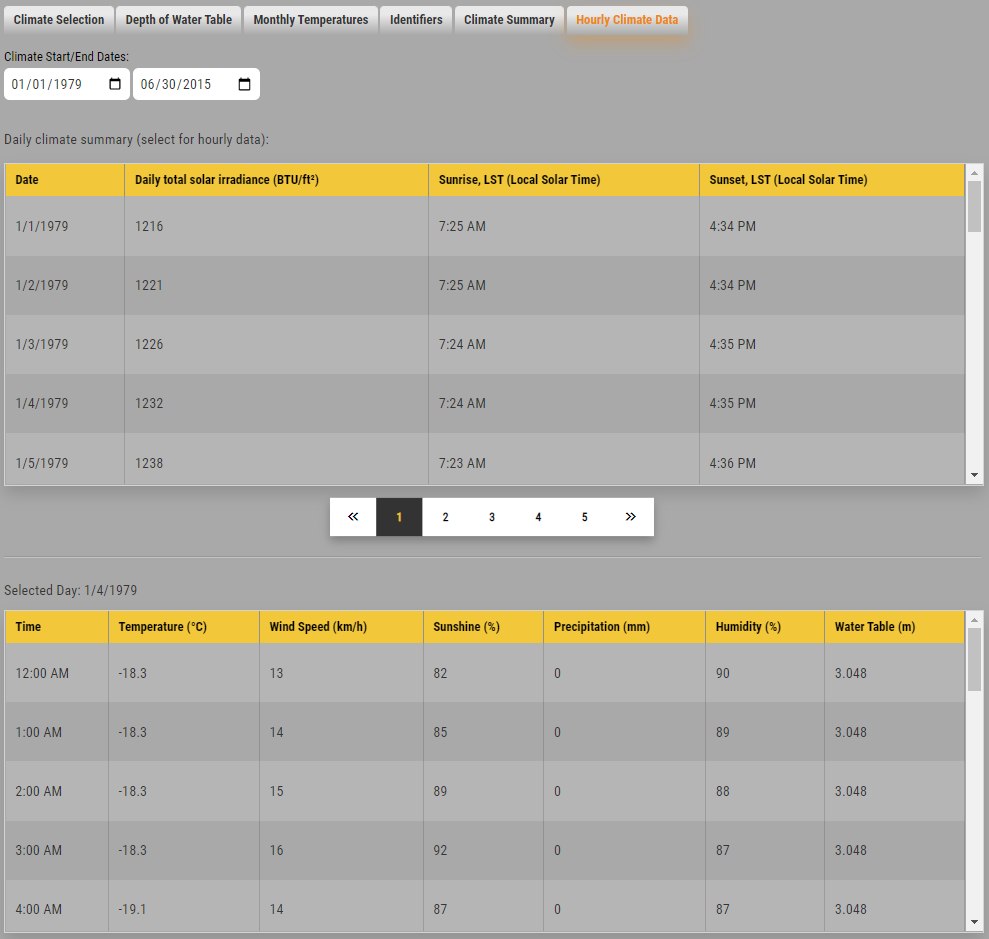
Figure 845: Monthly temperatures
- Start Date: Defines beginning date of the date range for which you want weather data.
- End Date: Defines the end date of the date range for which you want weather data.
- Weather Data Table: Defines various aspects of climate for the selected date range.
- Date/Hour: Defines the date and time associated with the climate information defined in the row.
- Temperature: Defines the temperature associated with the date/hour and other climate information defined in the row.
- Wind Speed: Defines the wind speed associated with the date/hour and other climate information defined in the row.
- Sunshine: Defines the percentage of sunshine associated with the date/hour and other climate information defined in the row.
- Precipitation: Defines the inches of precipitation associated with the date/hour and other climate information defined in the row.
- Humidity: Defines the humidity percent associated with the date/hour and other climate information defined in the row.
- Water Table: Defines the water table associated with the date/hour and other climate information defined in the row.