Traffic
This section provides details on using PMED’s tables and data to examine the effects of traffic loading on pavement design and lifespan.
Traffic data is one of the key data elements required for the structural design/analysis of pavement structures. It is required for estimating the loads that are applied to a pavement and the frequency with which those given loads are applied throughout the pavement design life. The traffic inputs are categorized by:
- General Inputs
- Axle Load Distribution Inputs
- Special Traffic
PMED uses a hierarchical approach (Levels 1 through 3) to define traffic inputs based on the source of traffic data available. These levels represent how well you can estimate future truck traffic characteristics for the roadway being designed. Level 1 data is considered as the most representative of the past and future traffic characteristics of the project. It uses the actual axle weights and truck traffic volume distributions measured using weigh-in-motion (WIM) and automatic vehicle classification (AVC) sites that are located on nearby highway segments, assuming that there are no features or major intersections that could change the truck traffic stream. The regional summaries (statewide averages) obtained from the agency traffic and planning departments can be considered as Level 2 data, while the Level 3 defaults (national averages) included in the program can be used when there are no regional data available from similar roadways.
Interface
Simply, go from the Design Nav Menu Item and click the pencil icon next to any listed design. Traffic is the third listed Action Menu item listed for any given design.
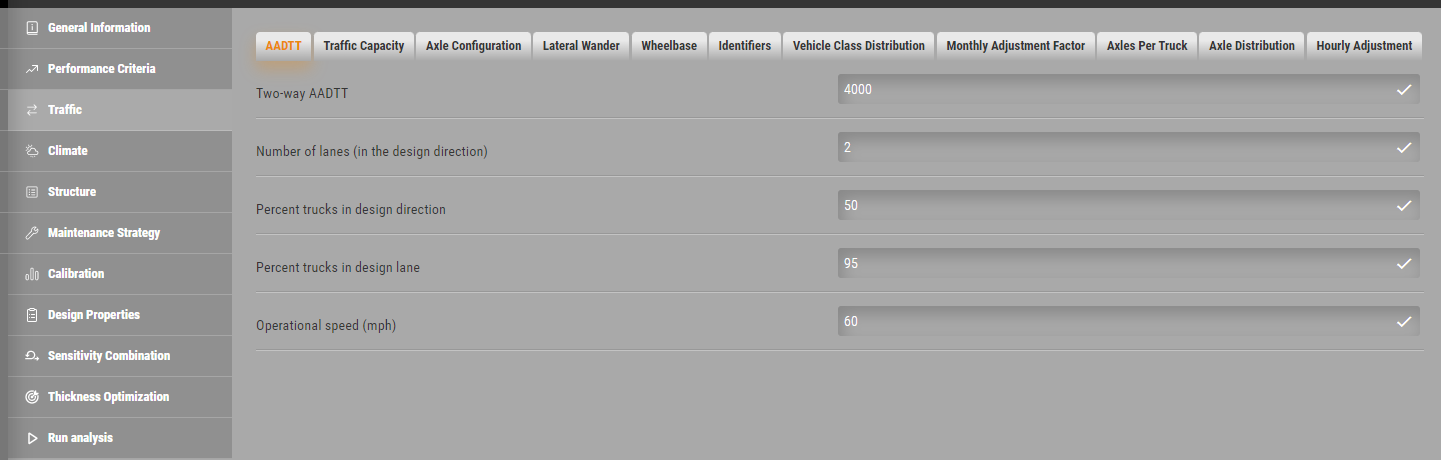
Figure 846: Traffic
General Traffic Inputs
Truck Volume and Speed
- Base year two-way AADTT: This control allows you to define the average annual daily truck traffic (FHWA vehicle classes 4-13) expected over the base year in both directions of travel for your project.
- Number of lanes in the design direction: This control allows you to define the number of lanes present in the design direction. The program uses the number of lanes to estimate the traffic distribution in each lane.
- Percent trucks in design direction: This control allows you to define the percentage of trucks (from the entire two-way AADTT count) that is expected to travel in the design direction. Note that although this value is close to 50 percent, it is not necessarily so especially in cases where truck traffic does not use the same route for the onward and return trips.
- Percent trucks in design lane: This control allows you to define percentage of trucks in the design direction expected to use the design lane (typically the outer right lane).
- Operational speed (mph): This control allows you to define the expected speed of traffic traveling in the design lane. Note that the inputs in this control impact the loading frequency of asphalt layers.
Traffic Capacity
This control opens the traffic capacity cap dialog, which allows you enforce a cap on estimated traffic volumes used in the design/analysis so that the expected highway capacity is not exceeded. In the Traffic tab, click on the Traffic Capacity Cap control.
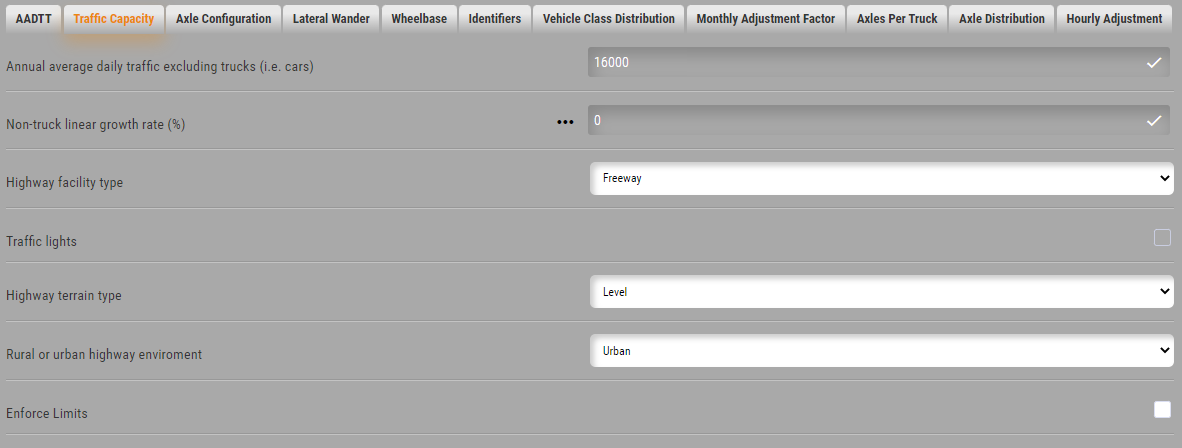
Figure 847: Traffic Capacity
- Annual average daily traffic excluding trucks: This control allows you to define theannual average daily volume of FHWA vehicle classes 1 through 3 (motorcycles, cars, pick-up trucks, vans and SUVs). This value is computed as the difference between annual average daily traffic (AADT) and annual average daily truck traffic (AADTT). AADT includes both cars (or light vehicles - classes 1-3) and trucks (classes 4-13).
- Non-truck linear traffic growth rate (%): This control allows you to define the annual linear growth rate of non-trucks (i.e., light vehicles - classes 1-3).
- Highway facility type: This control allows you to select freeway, multiple-lane highway, or two-lane highway.
- Traffic signal: Check this box to estimate highway capacity for signalized intersections.
- Highway terrain type: This control allows you to select whether the terrain is level (includes short grades of no more than 1 to 2 percent) or rolling (otherwise).
- Rural or urban highway environment: This control allows you to select an urban or rural highway environment.
- User-specified capacity limit: PMED by default internally computes capacity estimates based on the 2000 Highway Capacity Manual (HCM). Enable this control to define a specific value for capacity limit.
- Enforce highway capacity limits: Enable this control to enforce traffic capacity cap. Disable this control to prevent PMED from enforcing traffic capacity cap.
Axle Configuration
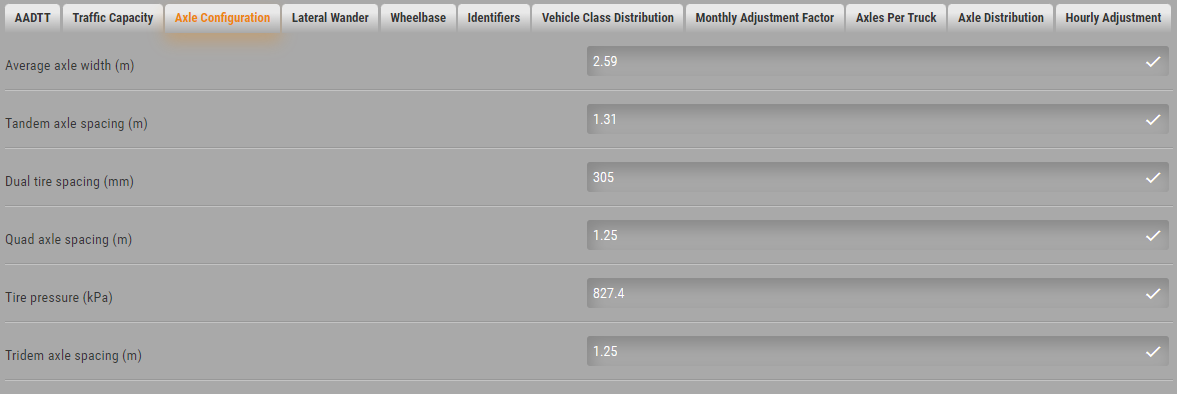
Figure 848: Axle Configuration
- Average axle width (ft): This control allows you to define the distance in feet between two outside edges of an axle. PMED provides a default value of 8.5 ft.
- Dual tire spacing (in.): This control allows you to define the transverse distance in inches between the centers of a dual tire. This value is calculated from WIM data measured over time by averaging the distance measured between the dual tires of a tandem, tridem, or quad axle for each truck class. PMED provides a default value of 12 in.
- Tire pressure (psi): This control allows you to define the hot inflation pressure of tires in pounds per square inch. It is assumed that the hot inflation pressure equals the contact pressure and is 10% above cold inflation pressure. PMED provides a default value of 120 psi.
- Tandem axle spacing (in.): This control allows you to define the center-to-center longitudinal spacing in inches between two consecutive axles in a tandem configuration. This value is calculated using WIM data by averaging distance measured between the tandem axles for each truck class. PMED provides a default value of 51.6 in.
- Tridem axle spacing (in.): This control allows you to define the center-to-center longitudinal spacing in inches between two consecutive axles in a tridem configuration. This value is calculated using WIM data by averaging distance measured between the tridem axles for each truck class. PMED provides a default value of 49.2 in.
- Quad axle spacing (in.): This control allows you to define the average distance in inches between two consecutive axles in a quad configuration. This value is calculated using WIM data by averaging distance measured between the quad axles for each truck class. ME Design provides a default value of 49.2 in.
Lateral Wander
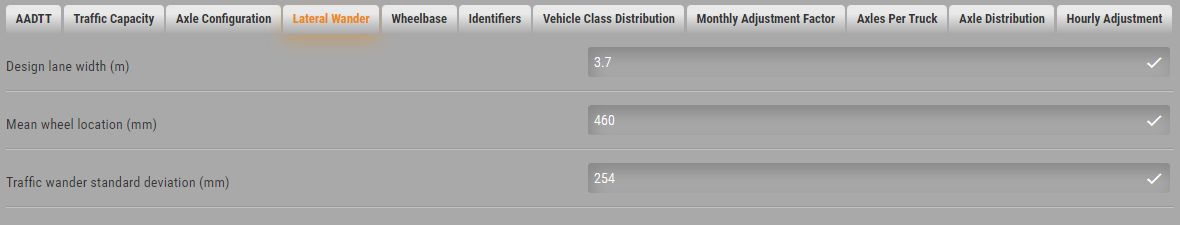
Figure 849: Lateral Wander
- Mean wheel location (in.): This control allows you to define the distance in inches from the outer edge of the wheel to the pavement marking. PMED provides a default value of 18 in.
- Traffic wander standard deviation (in.): This control allows you to define the divergence from average in inches of the lateral traffic wander. This standard deviation is used to estimate the number of axle load repetitions over a single point in a probabilistic manner for predicting distress and performance. ME Design provides a default value of 10 in.
- Design lane width (ft): This control allows you to define the distance in feet between the lane marking on either side of the design lane. PMED provides a default value of 12 ft.
Identifiers
Identifiers is a special metadata tab developed to help you keep track of important metadata about this design. Common default fields are Approver, Date approved, etcetera. But Users can generate additional fields as well.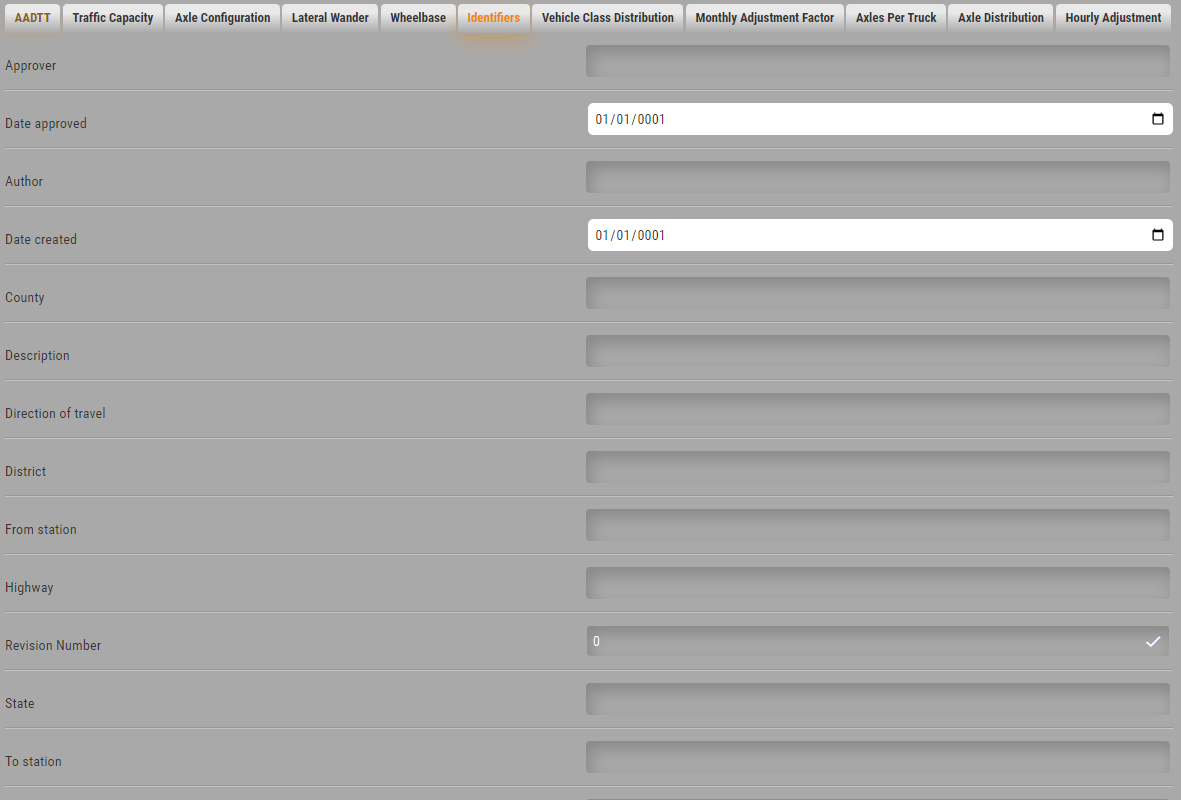
Figure 850: Identifiers
Wheelbase
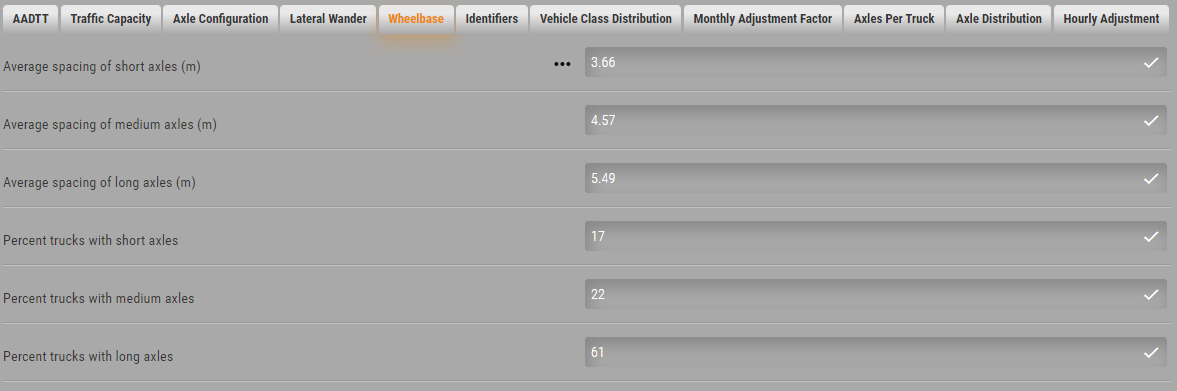
Figure 851: Wheelbase
- Average spacing of short axles (ft): This control allows you to define the average longitudinal spacing in feet of short axles. ME Design provides a default value of 12 ft.
- Average spacing of medium axles (ft): This control allows you to define the average longitudinal spacing in feet of medium axles. ME Design provides a default value of 15 ft.
- Average spacing of long axles (ft): This control allows you to define the average longitudinal spacing in feet of long axles. ME Design provides a default value of 18 ft.
- Percent of trucks with short axles: This control allows you to define the percentage of trucks in your design with short axles. ME Design provides a default value of 17 percent.
- Percent of trucks with medium axles: This control allows you to define the percentage of trucks in your design with medium axles. ME Design provides a default value of 22 percent.
- Percent of trucks with long axles: This control allows you to define the percentage of trucks in your design with long axles. ME Design provides a default value of 61 percent.
Vehicle Class Distribution and Growth
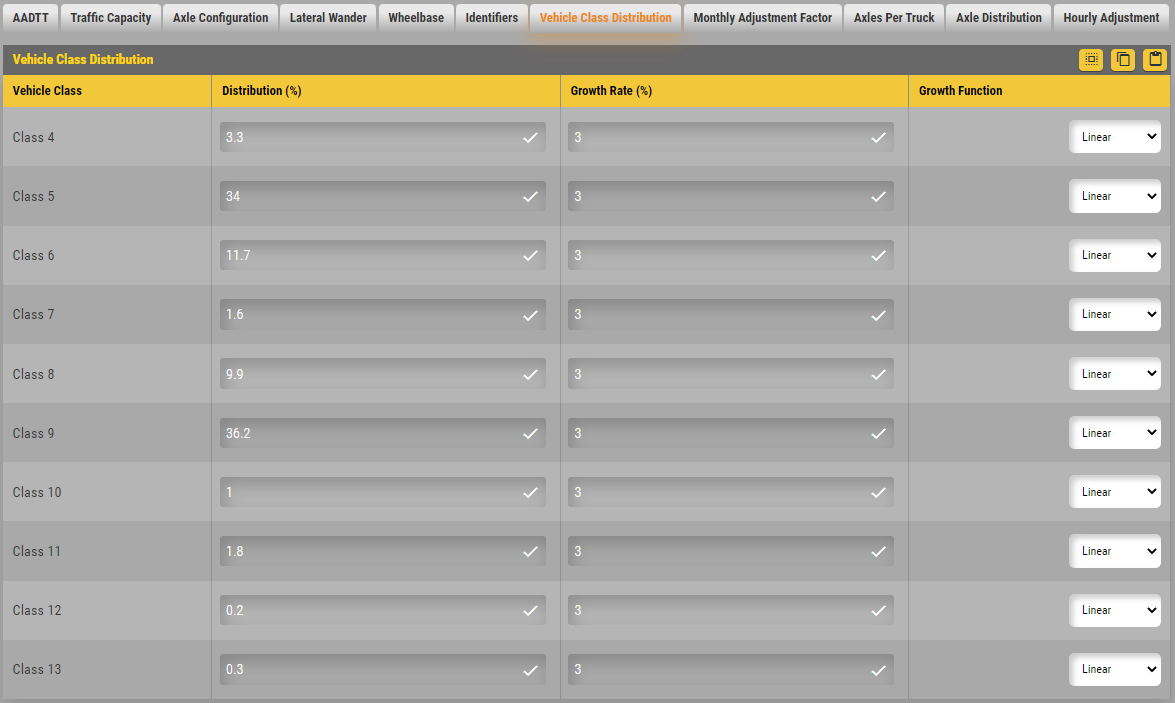
Figure 852: Vehicle Class Distribution
Load Default Distribution: This button opens the Truck Traffic Classification (TTC) Groups dialog to load default vehicle class distribution factors based on the group that best describes the truck traffic mix for your project.
Vehicle Class: This column displays the 10 classes (classes 4-13) used to classify types of trucks.
Distribution (%): This column allows you to define the percentage of each vehicle class designated for the selected TTC group. The column will run a total, which displays in the bottom row and should always equal 100.
Growth rate: This column allows you to define the common growth of truck volume based on the function of the truck class.
Growth function: This control allows you to select the traffic growth function to compute the growth or decay in truck traffic over time (forecasting truck traffic). Select one of the following options:
- None: This option sets traffic volume to remain the same throughout the design life.
- Linear: This option allows traffic volume to increase by constant percentage of the base year traffic across each truck class growth to happen at the defined rate.
- Compound: This option allows traffic volume to increase by constant percentage of the preceding year traffic across each truck class.
Monthly Adjustment Factors
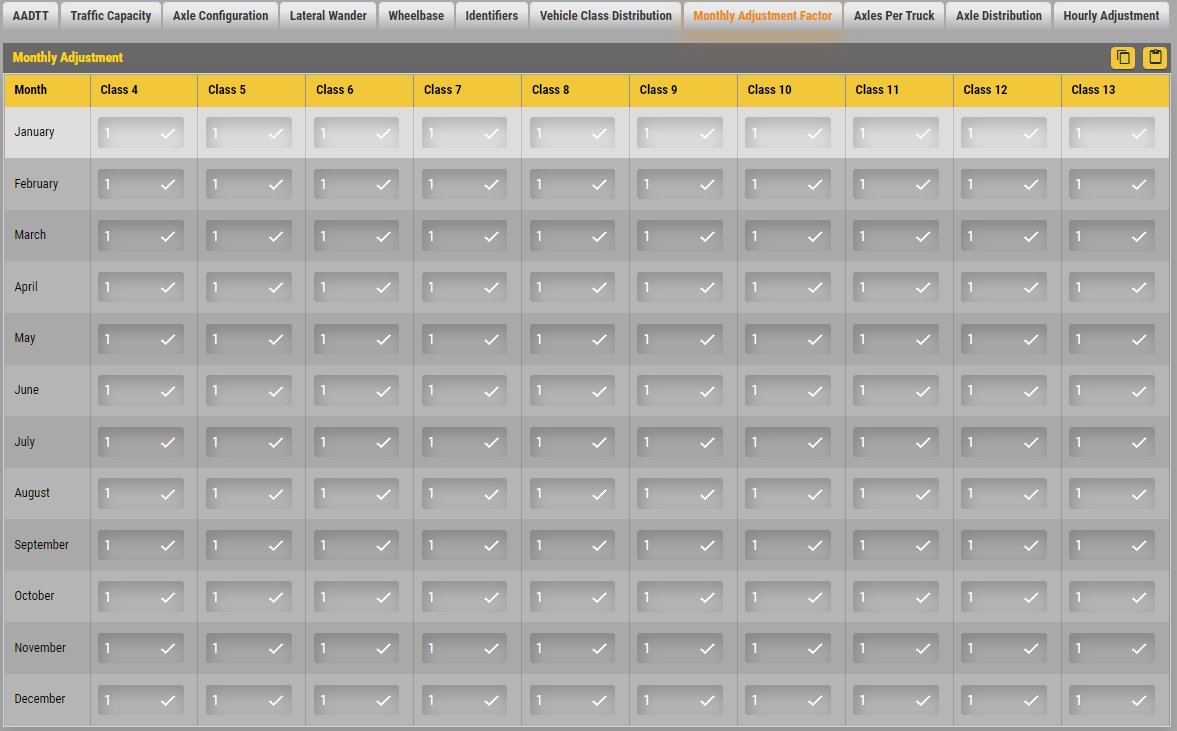
Figure 853: Monthly Adjustment Factors
- Monthly Adjustment Table: This table allows you to distribute the truck traffic within each class throughout the year. Truck traffic monthly adjustment factors represent the proportion of the annual truck traffic for a given truck class that occurs in a specific month. In other words, the monthly distribution factor for a specific month is computed by dividing the monthly truck traffic for the given class for the month by the total truck traffic for that truck class for the entire year. The default values are 1.0 for each month assuming no seasonal variations in truck volume. You can override the defaults to enter project-specific values. The sum of monthly factors for all months (column-wise) for each vehicle class must equal 12.
Axles Per Truck
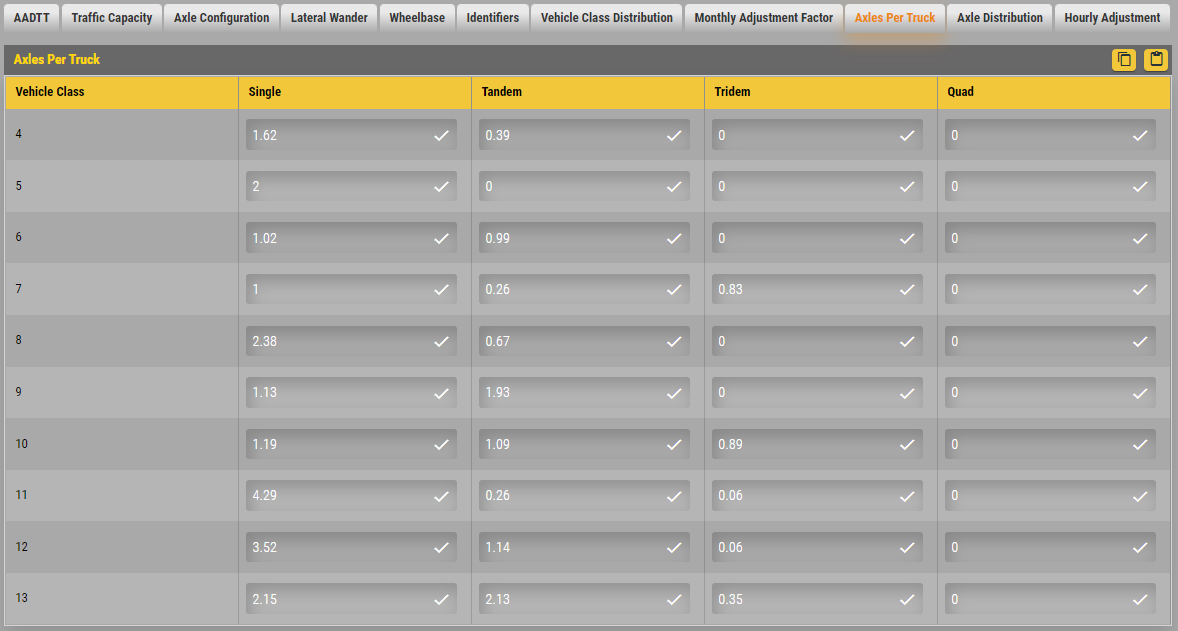
Figure 854: Axles Per Truck
- Axles Per Truck Table: This table allows you to define the average number of axles for each truck class (classes 4 to 13) for each axle type (single, tandem, tridem, and quad). You can override the defaults populated in the table to enter project-specific values.
Hourly Adjustment Factors (Rigid Pavements only)
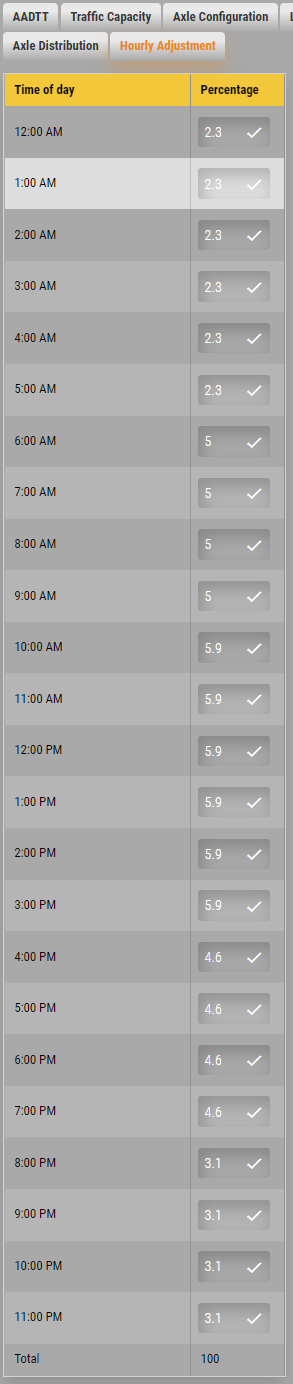
Figure 855: Hourly Adjustment
- Hourly Adjustment Table: This table allows you to define the hourly distribution factors, as the term describes, is the fraction (in percentage) of truck traffic traveling in a given hour relative to the 24-hour period. It is calculated from hourly AVC/WIM or vehicle count data measured over time by dividing the average annual truck traffic within a particular hour by the AADTT. The hourly adjustment factors are constant over time and between truck classes. The sum of the 24-hourly distribution factors must equal 100. You can override the defaults populated in the table to enter project-specific values.
Note: The hourly adjustment factor input is not displayed for design strategies with a flexible surface layer.
Axle Load Distribution
These tabs allow you to define the axle load distribution factors, which simply represent the percentage of the total axle applications within each load interval for a specific axle type (single, tandem, tridem, and quad), vehicle class (classes 4 through 13) and month of the year.
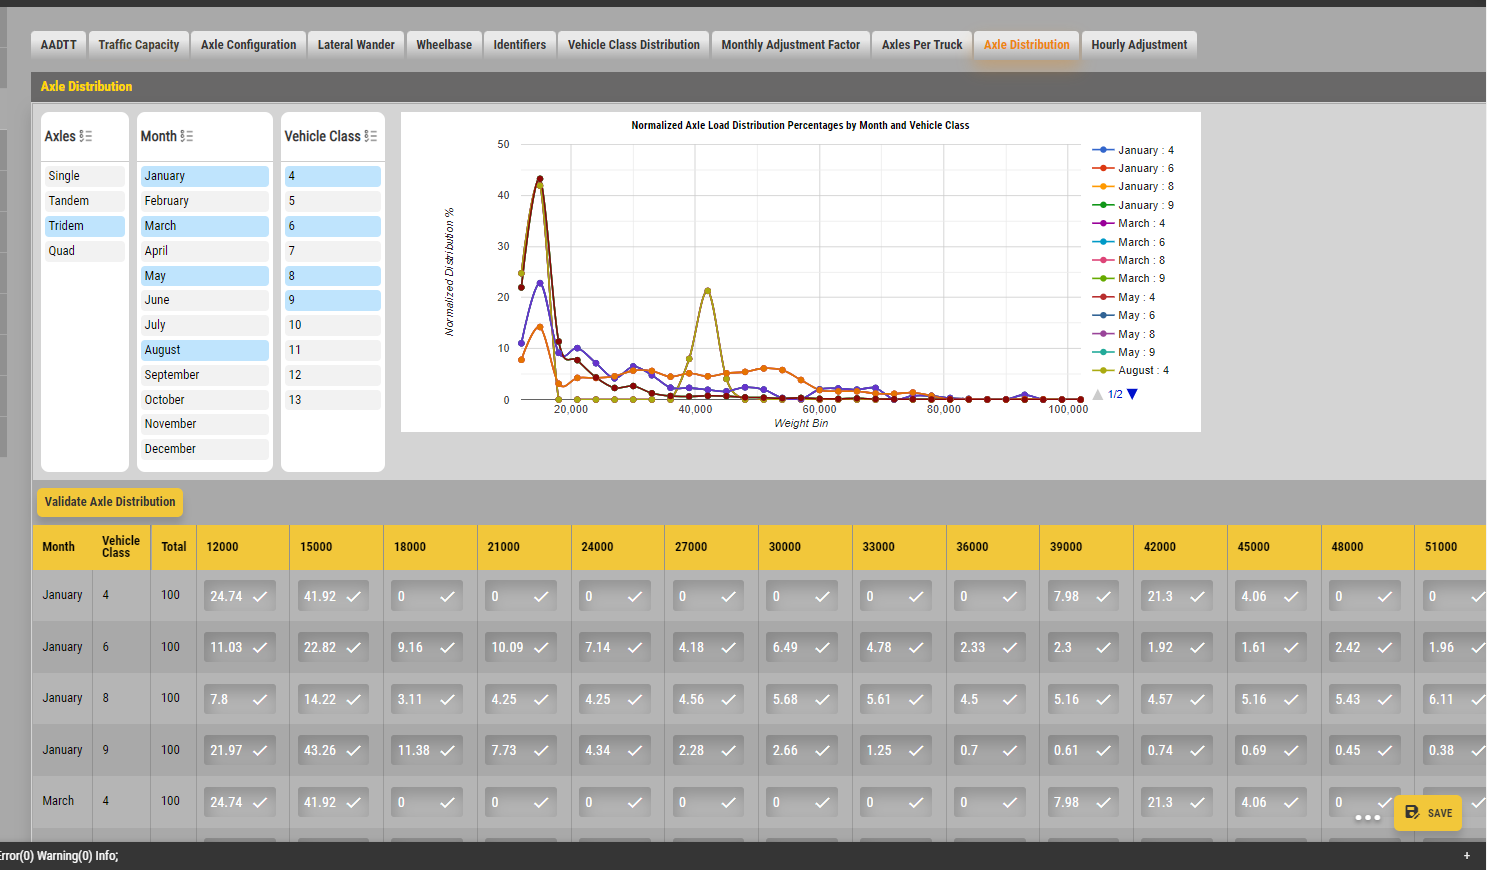
Figure 856: Axle Distribution
The following lists the load intervals for each axle type:
- Single Axle Load Distribution: 3,000 lb to 41,000 lb at 1,000-lb intervals
- Tandem Axle Load Distributions: 6,000 lb to 82,000 lb at 2,000-lb intervals
- Tridem and Quad Axle Load Distributions: 12,000 lb to 102,000 lb at 3,000-lb intervals
- Axle Distribution Table: This table allows you to define the percentage of the total axle applications within each load interval for a specific axle type (single, tandem, tridem, and quad) and vehicle class (classes 4 through 13). There are four ways to enter data in the table: enter data manually, import an axle load file in MEPDG (.alf) format, retrieve the data from the PMED database, or import third party data in an XML format.
Special Traffic
Flexible Pavements Special Traffic
In addition to the regular traffic analysis (mix of single, tandem, tridem, and quad axle vehicles), the flexible pavement design procedure has an alternative traffic procedure for analyzing special axle configurations. The primary intended function of the special axle analysis routine is to structurally analyze pavement performance when subjected to special, heavy, non-conventional off-road vehicle systems that are often subject to special permitting requirements.
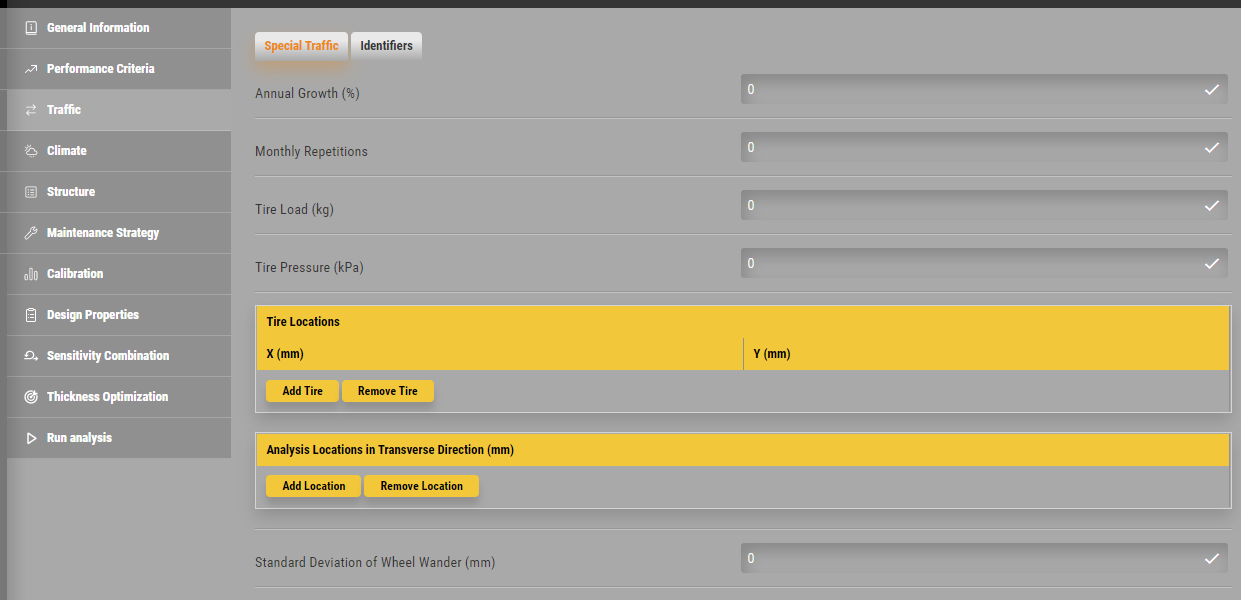
Figure 857: Special Traffic
The Special Traffic input screen allows you to define the following inputs:
- Tire load: This control allows you to define the load on a single tire within the gear assembly. It is assumed that the remaining tires in the design gear will have the same load.
- Tire pressure: This control allows you to define the hot inflation pressure of tires in pounds per square inch. It is assumed that the hot inflation pressure equals the contact pressure and is 10 percent above the cold inflation pressure.
- Traffic wander standard deviation (in.): This control allows you to define the divergence from average of the lateral traffic wander. Pavement ME Design provides a default value of 10 inches.
- Begin date: This control allows you to define the start date of the special axle loading.
- End date: This control allows you to define the end date of the special axle loading.
- Monthly repetitions: This control allows you to define the number of special load repetitions for the initial year of loading.
- Annual growth (%): This control allows you to define the linear growth rate of monthly repetitions.
- Tire location: This control allows you to define the coordinates of each tire in both the transverse (X) direction and the direction of traffic (Y).
- Analysis location: This control allows you to define coordinates in traffic directions for distress analysis.
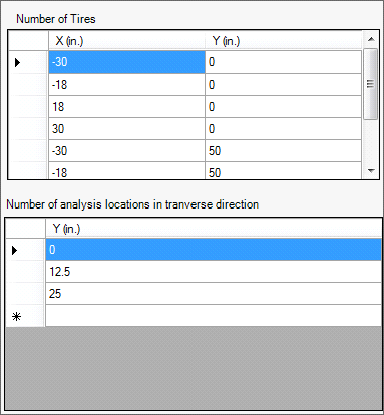
Figure 858: Special Traffic Analysis and Tire Placement Inputs
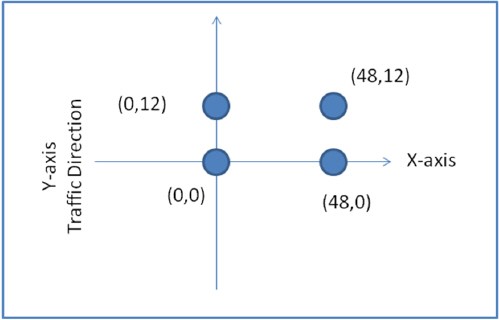
Figure 859: Special Traffic Configuration